EN
-
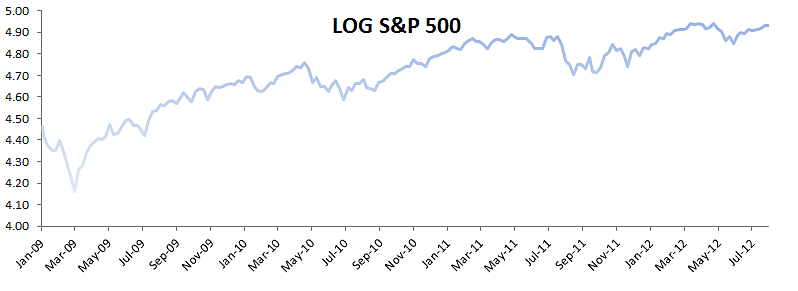
SPDR log-prices
a plot for daily log prices of S&P 500 ETF between Jan 2009, and July 2012
-
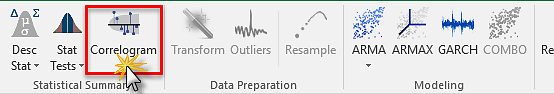
Correlogram icon in NumXL Tab
NumXL toolbar with correlogram icon selected
-
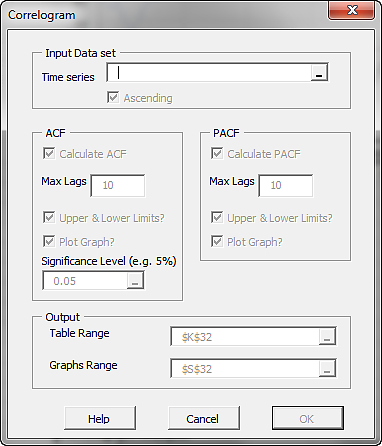
NumXL Correlogram Wizard
NumXL Correlogram Wizard or dialog box
-
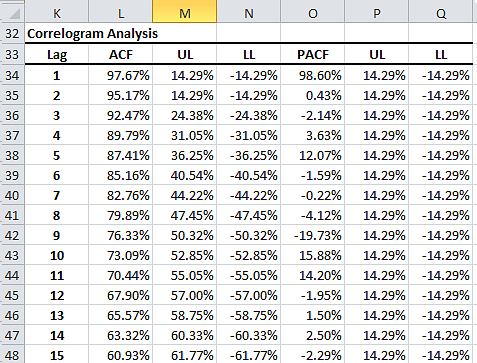
Correlogram output table for &P 500 log monthly prices
The autocorrelation (ACF) and PACF table for the S&P 500 log monthly prices
-
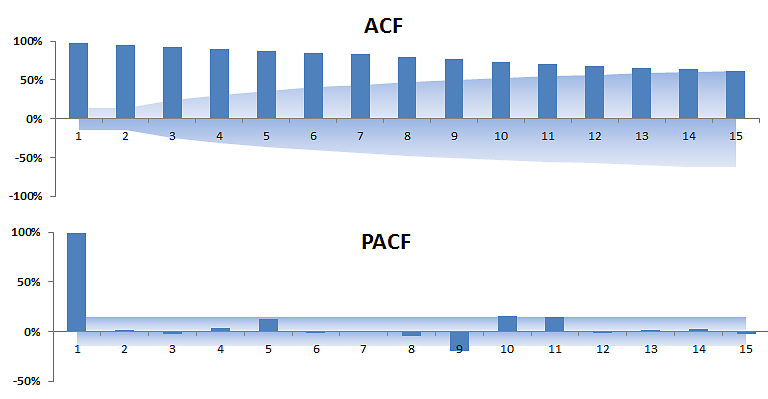
Correlogram plot for S&P500 monthly prices
The autocorrelation (ACF) and PACF plot for the S&P 500 log monthly prices
-
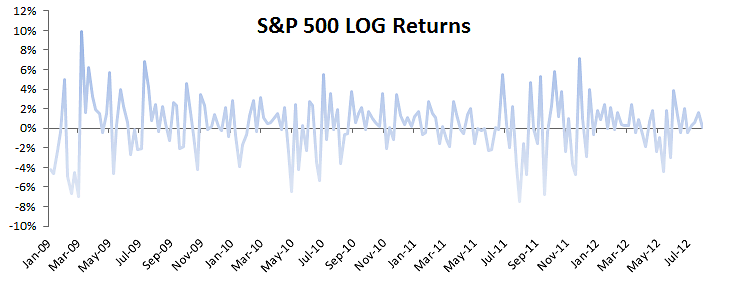
Plot for S&P 500 monthly log return
Plot for S&P 500 ETF monthly log returns
-
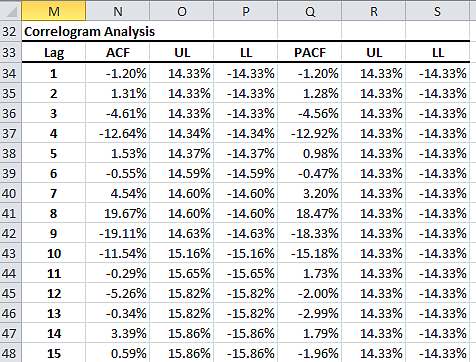
Correlogram table for S&P 500 monthly log returns
Correlogram output table for the S&P 500 monthly log returns.
-
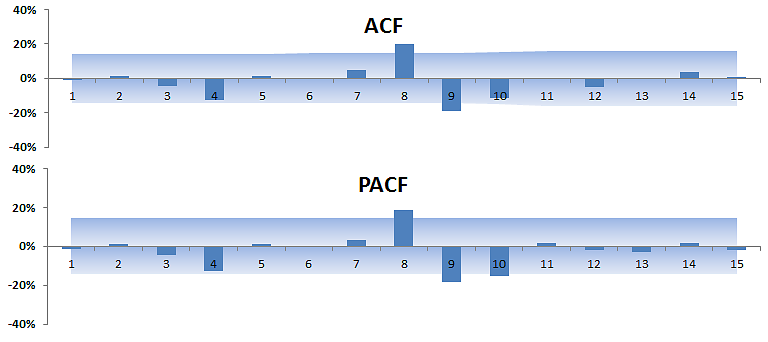
Correlogram plot for S&P 500 monthly log returns
The Correlogram or ACF & PACF plot for S&P 500 monthly log returns. (Generated by NumXL correlogram wizard)
-
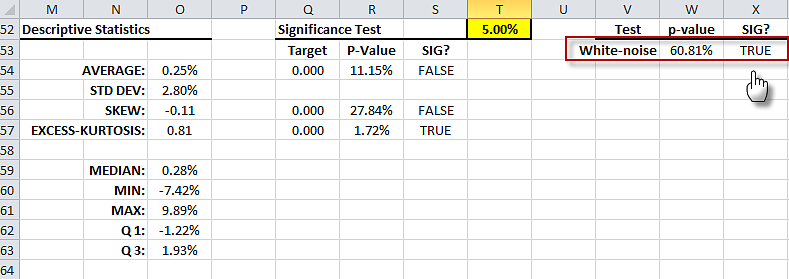
Summary Statistics table for S&P 500 monthly log return
Summary Statistics output table for S&P 500 monthly log returns with highlighted white-noise test.
-
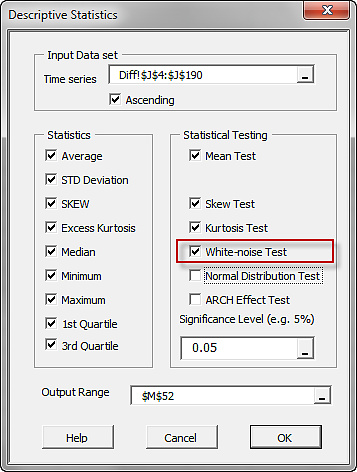
Select white-noise test in NumXL Descriptive Statistics wizard.
selecting a white-noise test in NumXL descriptive statistics wizard or dialog box.
-
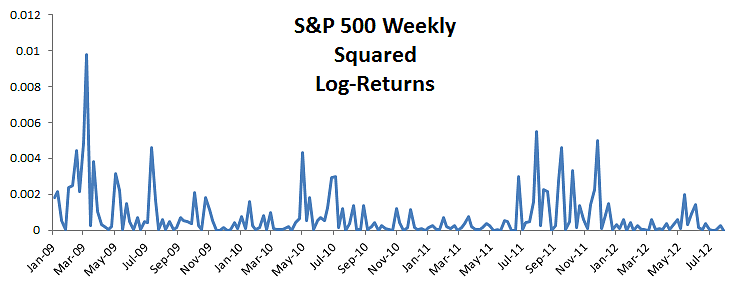
Plot for the S&P 500 squared monthly log returns.
Plot for the S&P 500 squared monthly log returns.
-
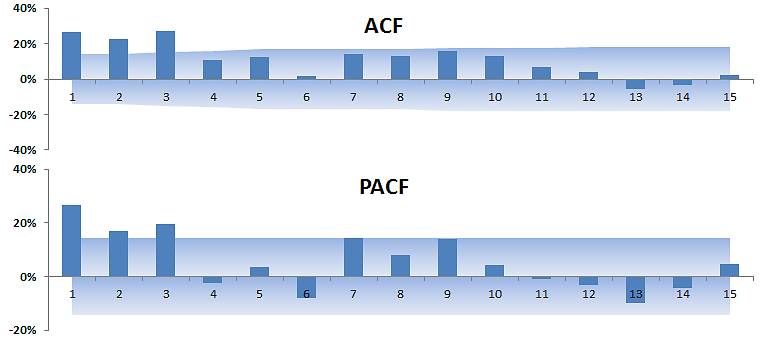
Correlogram plot for S&P 500 squared log monthly returns
Correlogram or ACF and PACF plot for the S&P 500 squared log monthly returns
-
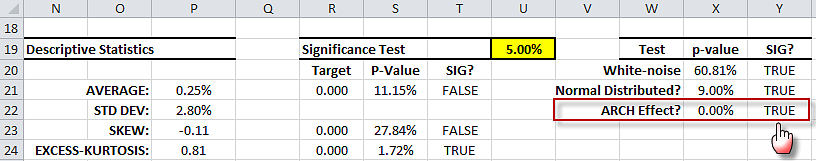
The summary statistics table showing ARCH effect test
ARCH Effect test results for S&P 500 monthly log returns