EN
-
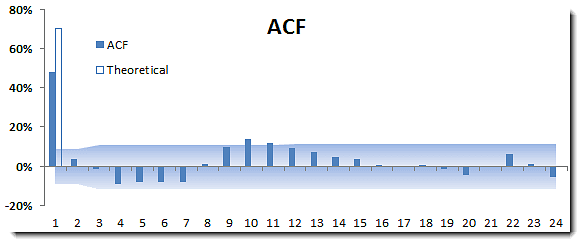
MA-1-ACF.png
Autocorrelation Function Plot for Simulated MA(1) Process
-
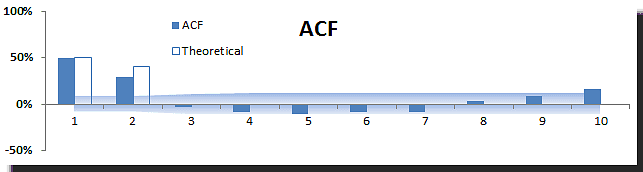
MA-2-ACF.png
Autocorrelation Function Plot for Simulated MA(2) Process
-
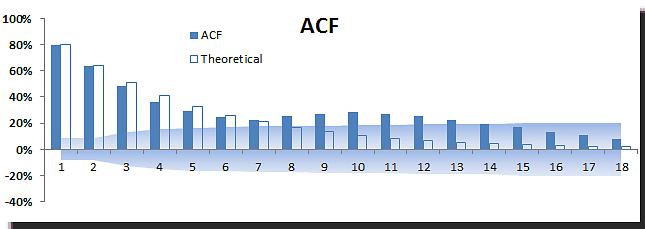
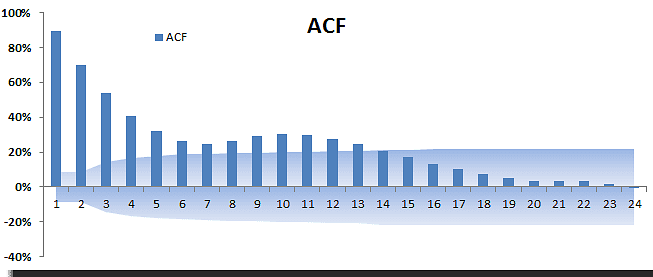
AR-1-ACF.png
ACF Plot For a Simulated AR(1) Process
-
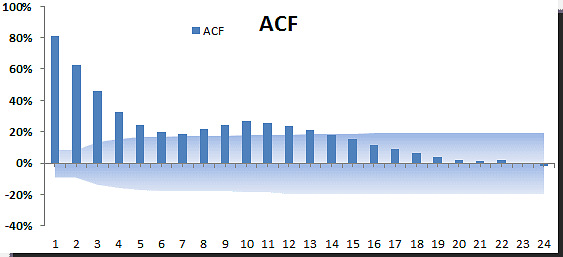
AR-2-ACF.png
ACF Plot For Simulated AR(2) Process
-
ARMA-1-1-ACF.png
ACF Plot for Simulated ARMA(1,1) Process
-
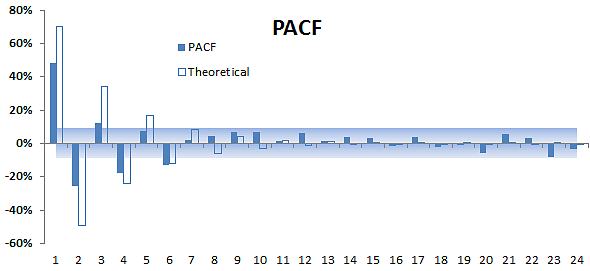
MA-1-PACF.png
PACF Plot for Simulated MA(1) Process