EN
-
DATA-PLOT.png
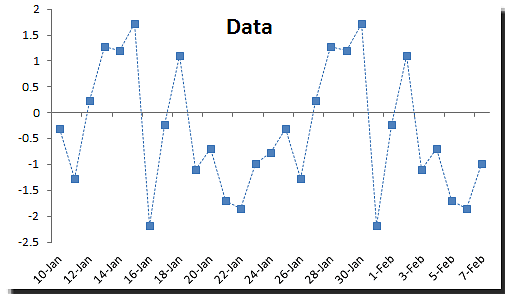
Los Angeles Ozone Levels Data Plot
-
ORIGINAL-DESC-STAT-TABLE.png
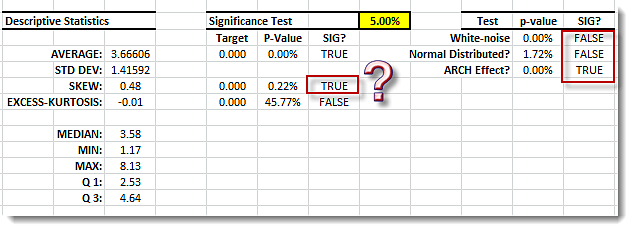
LA Ozone Levels Descriptive Statistics Table
-
Correlogram-table_0.png
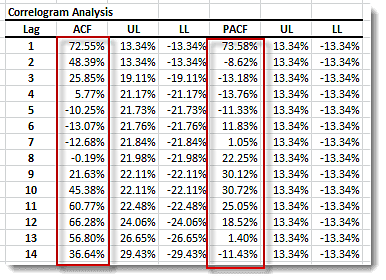
Correlogram Analysis Table
-
Correlogram-plot_0.png
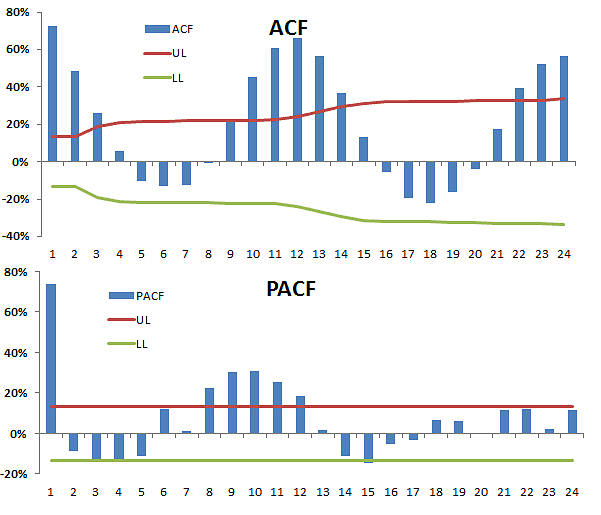
Correlogram ACF and PACF Plots
-
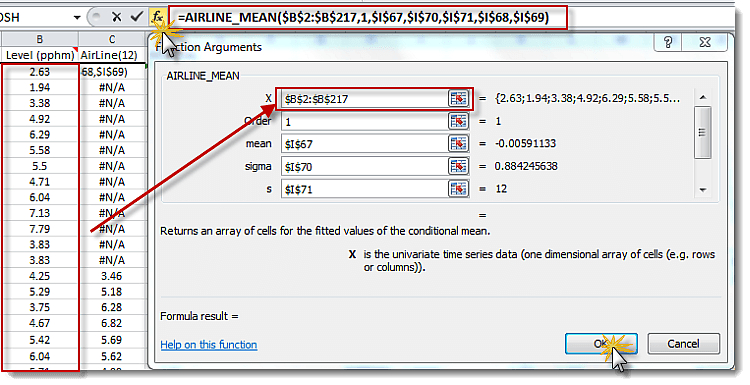
AIRLINE_MEAN_WIZARD.png
Airline Mean Wizard Table
-
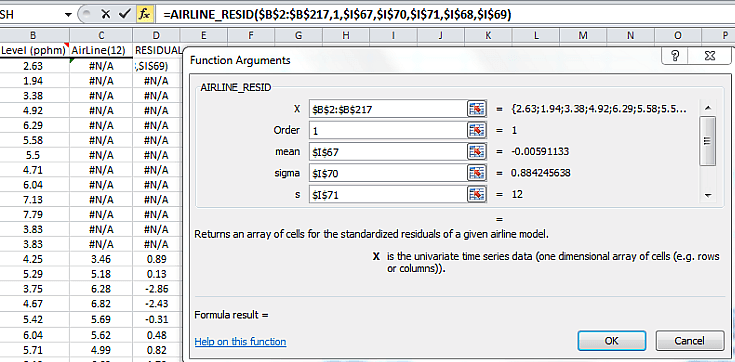
AIRLINE_RESID_WIZARD.png
Airline Model Residuals Wizard Table
-
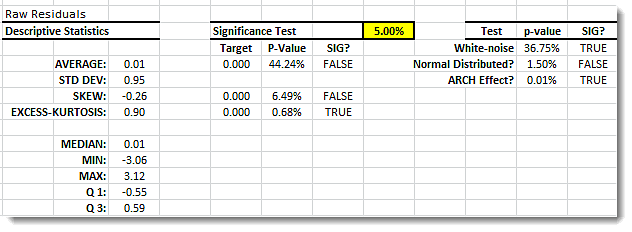
STD-RESID-SUMMARY-STAT.png
Standardized Residuals Summary Stats Table
-
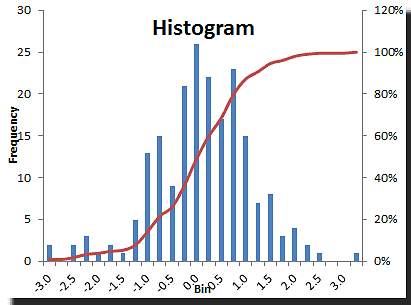
STD-RESID-Histogram.png
Standardized Residuals Histogram
-
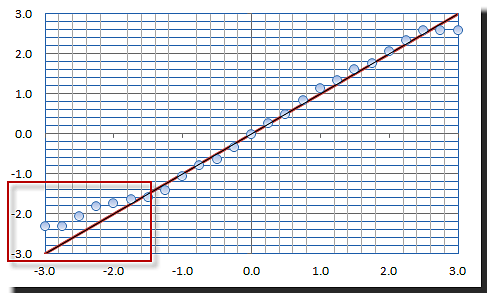
STD-RESID-QPLOT.png
Standardized Residuals Q-Q Plot
-
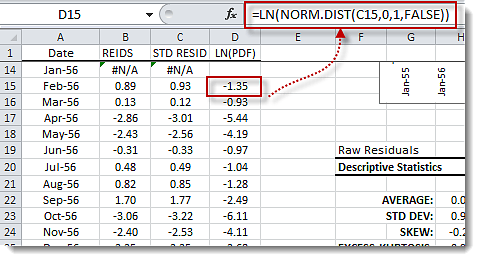
LN-PDF-STD-RESID.png
Log-Likelihood for Standardized Residuals
-
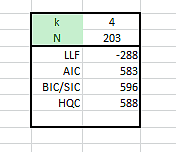
GOF-TBL.png
Manual LLF Calculation
-
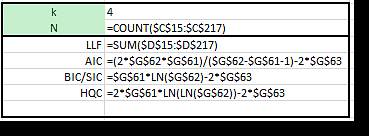
GOF-TBL-Formulas.png
Manual LLF Calculation Formula