EN
-
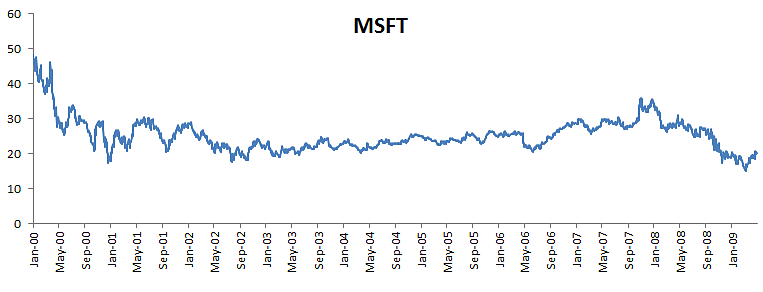
msft-price-plot.png
Microsoft stock price plot. Microsoft stock prices between Jan 2000 and Jan 2009
-
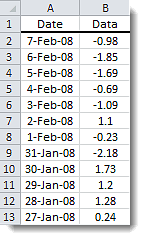
Ascending-table.png
Data table showing a descending chronicle order
-
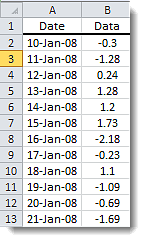
Descending-table-0.png
-
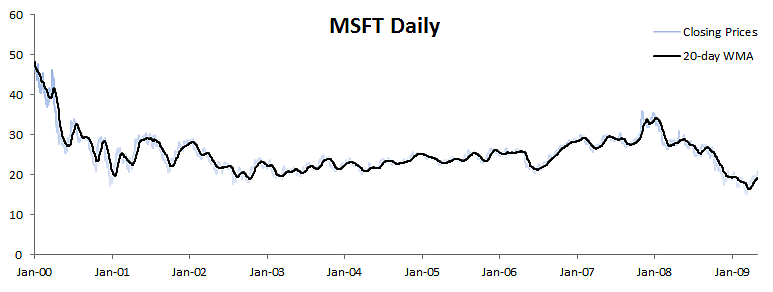
msft-price-wma-plot.png
Microsoft stock price plot with 20-day equally-weighted moving average
-
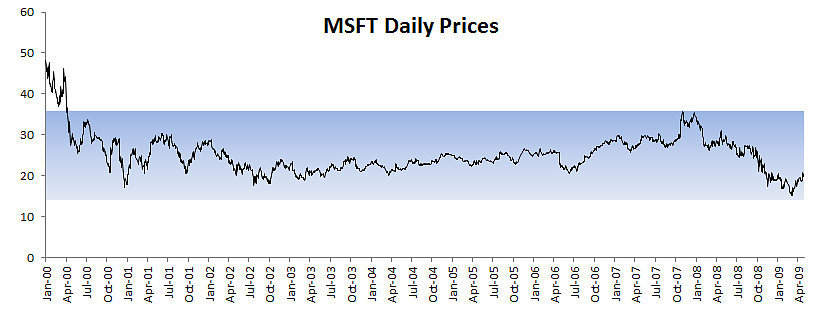
msft-prices-q1-q3-band.png
Microsoft stock price plot with a shaded band represent values between 1st quartile (Q1) and third quartile (Q3)
-
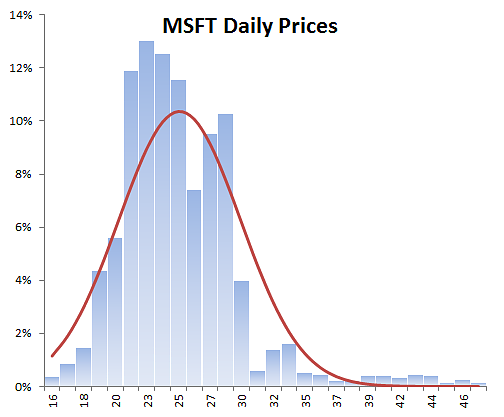
msft-prices-histogram.png
Histogram for daily microsoft prices between Jan 2000 and Jan 2009
-
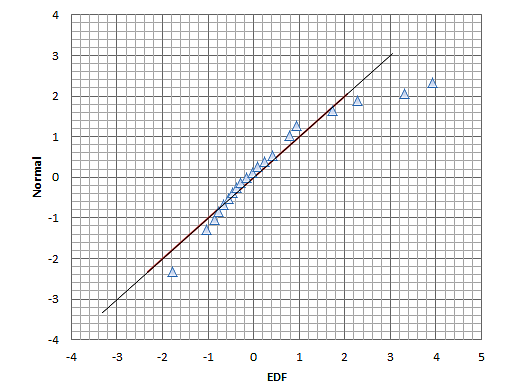
msft-prices-qqplot.png
A QQ Plot for Microsft price distribution between Jan 2000 and Jan 2009
-
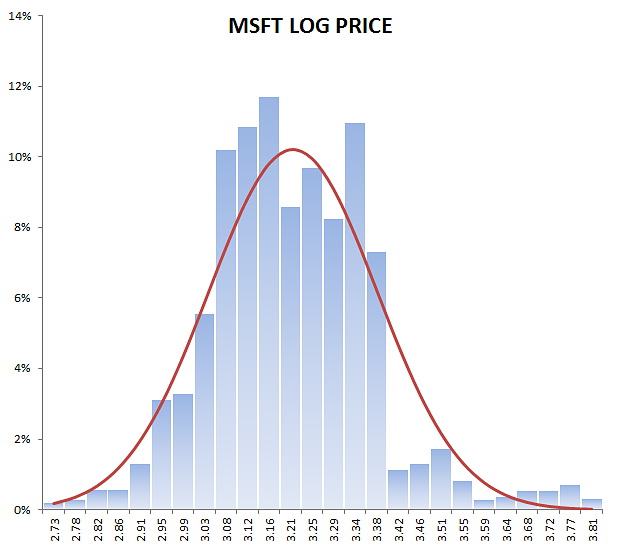
msft-log-price-histogram.png
Histogram plot for log log daily prices for Microsoft stock.
-
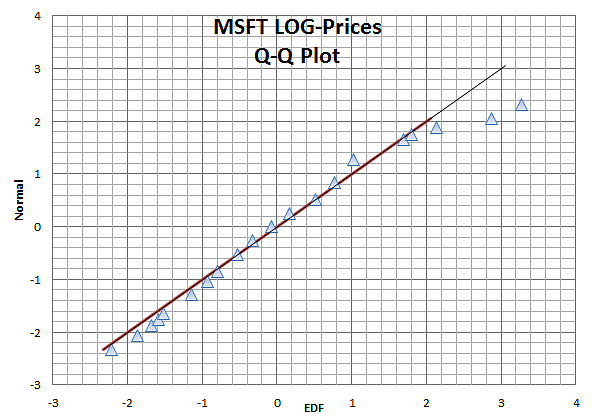
msft-log-price-qqplot.png
A QQ Plot for the distribution of Microsoft stock log prices.