-
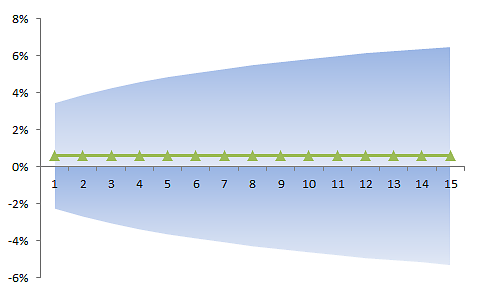
Plot for Forecast values and their confidence interval
In the plot, we have the mean forecast (line), and the 95% confidence interval represented by the shaded area.
-
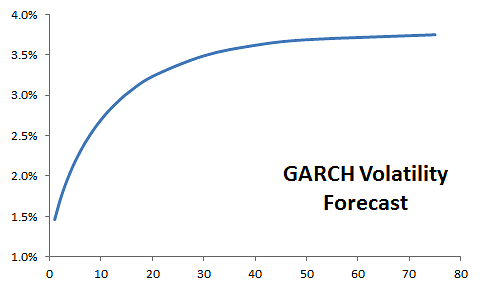
GARCH(1,1) Local olatility forecast for S&P 500 log monthly returns
In this plot, we show the local volatility (aka forecast standard error) over the forecast horizon. Note that volatility revert to…
-
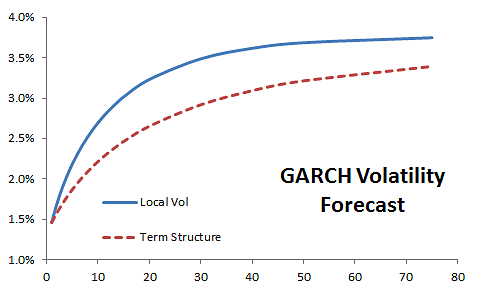
Plot for Local and term structure volatility forecast using GARCH model
In this plot, the local (aka forecast error) and term structure volatility forecast are plotted together. Note that both curve con…
-
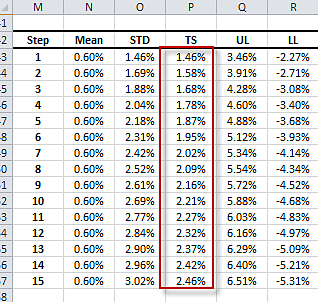
GARCH(1,1) Forecast table showing term structure volatility
In this GARCH(1,1) forecast table (generated by NumXL Forecast wizard), the volatility term structure forecast are shown in the re…
-
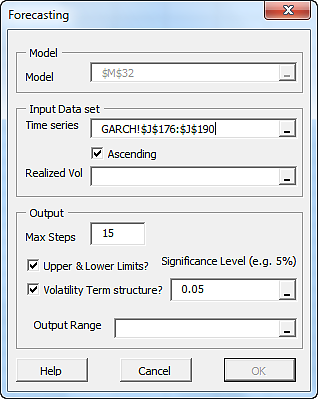
NumXL forecast wizard/dialog
The NumXL Forecast wizard/dialog pops up. The model reference cell is already selected and grayed out in the dialog.
-
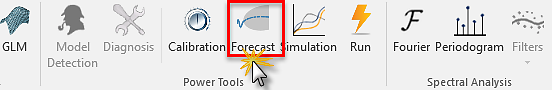
Selecting forecast icon in NumXL toolbar
After you select the top cell in GARCH(1,1) Model table, locate the forecast icon in NumXL toolbar (aka Tab), and click it to Invo…
-
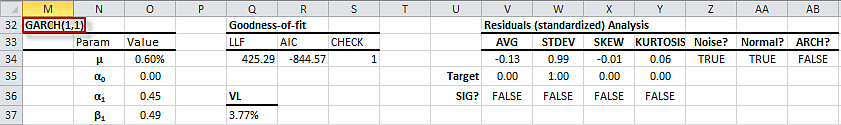
Calibrate GARCH(1,1) model table
After we calibrate the GARCH(1,1) model, and verified its assumptions by examining the residuals, we are ready to use it for forec…
-
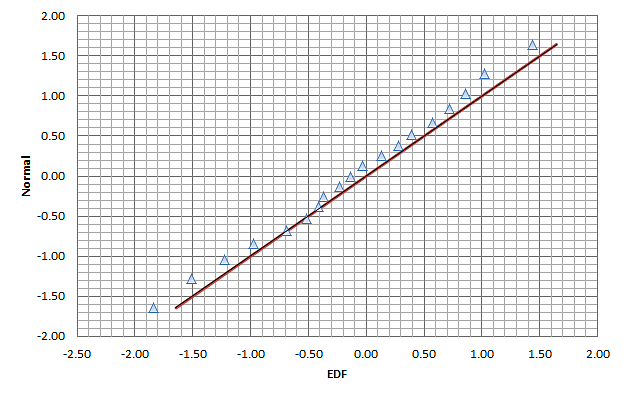
QQ-Plot for GARCH(1,1) standardized residuals
A QQ Plot for the standardized residuals of the calibrated GARCH(1,1) model.
-
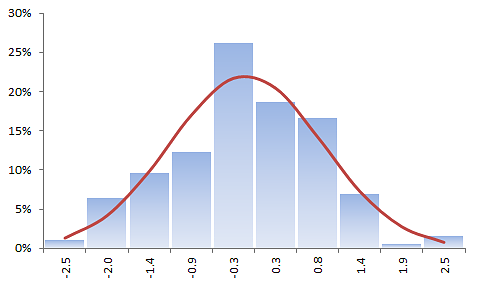
Histogram plot for RCH(1,1) standardized residuals
A histogram plot for the standardized residuals of the calibrated GARCH(1,1) model with an overlay Gaussian distribution curve.
-
Residuals Diagnosis -Examine the serial correlations in the residuals
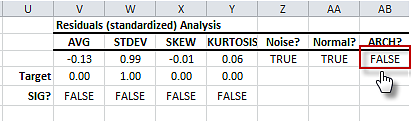
In the residuals diagnosis table, we perform a statistical test for the presence of inter dependency(aka serial correlation) in th…
-
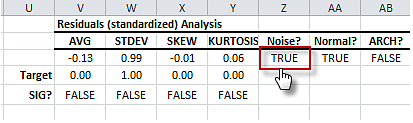
Residuals Diagnosis -Examine the ARCH effect in the residuals
In the residuals diagnosis table, we perform a statistical test for the ARCH Effect (i.e. presence of inter dependency(aka serial…
-
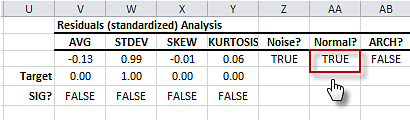
Residuals Diagnosis -Examine the normality distribution of the residuals
In the residuals diagnosis table, we perform a statistical test for the normal distribution assumption of the of the standardized…
-
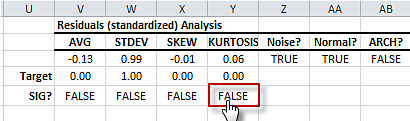
Residuals Diagnosis -Examine the sexcess kurtosis of the residuals
In the residuals diagnosis table, we perform a statistical test for the significance of the standardized residuals excess-kurto…
-
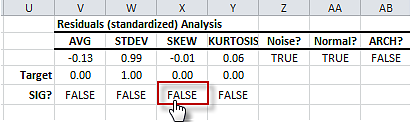
Residuals Diagnosis -Examine the skewness of the residuals
In the residuals diagnosis table, we perform a statistical test for the significance of the standardized residuals distribution…
-
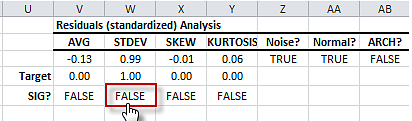
Residuals Diagnosis - Testing for standard deviation(i.e. sigma)
In the residuals diagnosis table, we perform a statistical test for the significance of the standardized residuals standard dev…
-
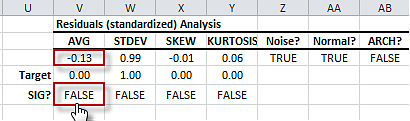
Residuals Diagnosis -Examine the mean of the residuals
In the residuals diagnosis table, we perform a statistical test for the significance of the standardized residuals mean against…
-
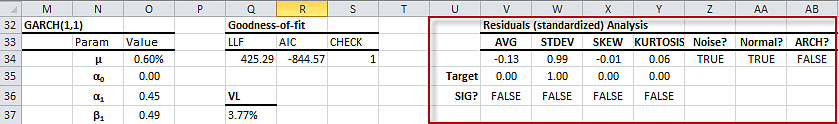
Residuals diagnosis section in GARCH Model table
In the generated GARCH model table, the rightmost section contains tests and check for the standardized residuals to verify the un…
-
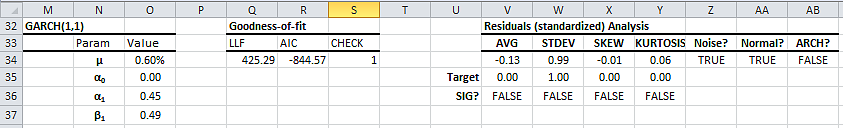
GARCH(1,1) Model table with calibrated values
Upon solver successful completion, the optimal values of the GARCH(1,1) model are inserted in the table, and calculation referenci…
-
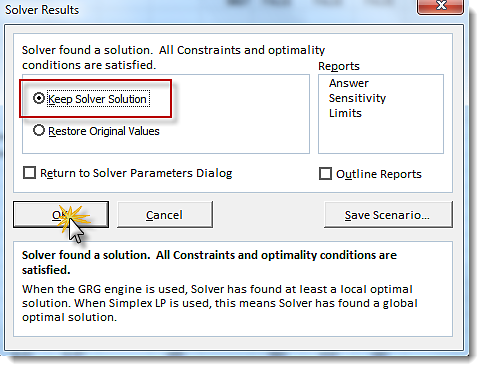
Excel Solver Found a Solution for GARCH(1,1) calibration
Excel Solver found a solution for the calibration problem of the GARCH Model
-
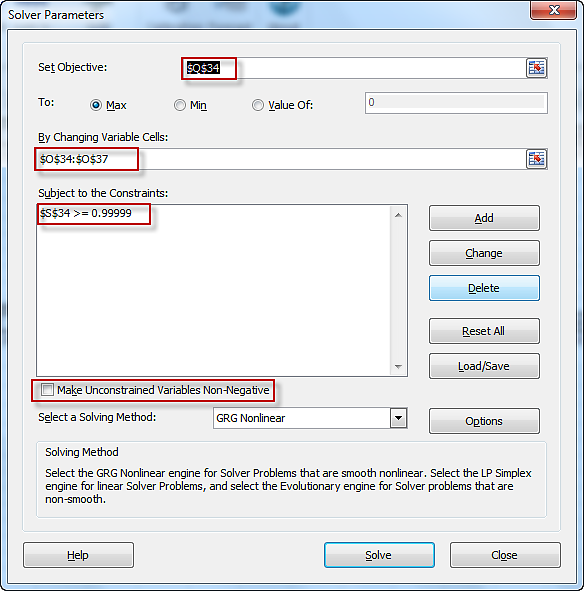
Excel Solver with GARCH(1,1) model calibration settings
NumXL launch Excel Solver with its fields initialized with model's cells: parameters, utility function (i.e. LLF) and the constrai…
-
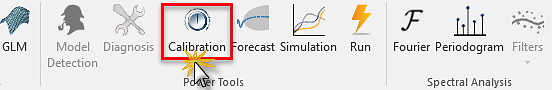
Selecting the calibration icon in NumXL toolbar
Select the header cell of the model table, Locate the calibration icon in NumXL Toolbar (aka Tab), in the Power Tools section, and…