-
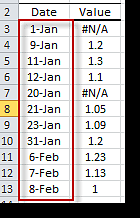
table-with-uneven-spaced-obs.png
Uneven Spacing Table
-
uneven-spaced-ts.png
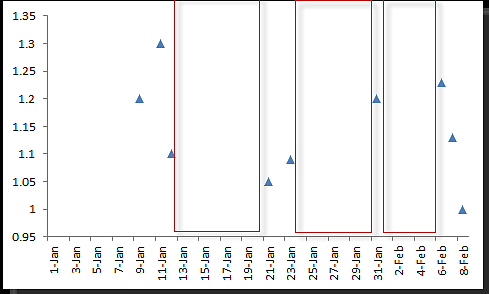
Uneven Spacing Plot
-
cspline-Interpolation.png
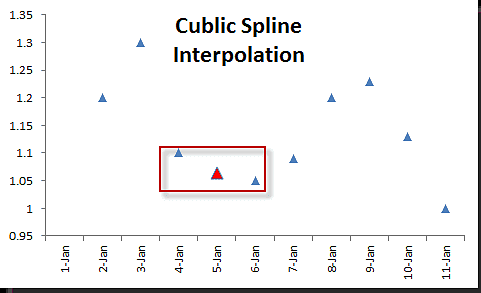
Cubic Spline Interpretation Plot
-
Linear-Interpolation.png
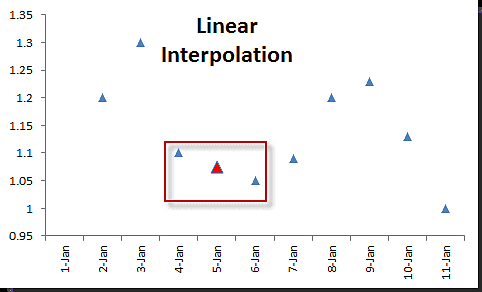
Linear Interpretation Plot
-
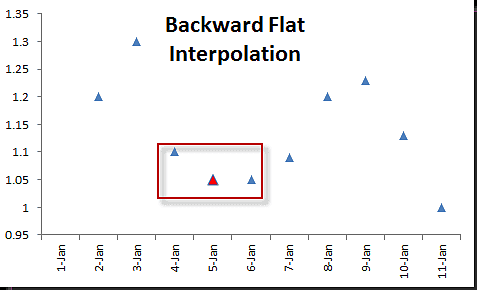
BKWD-Flat-Interpolation.png
Backward-flat Interpretation Plot
-
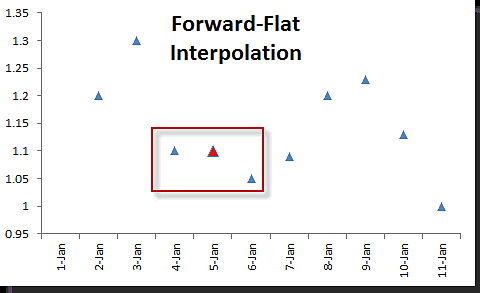
FWD-Flat-Interpolation.png
Forward-flat Interpretation Plot
-
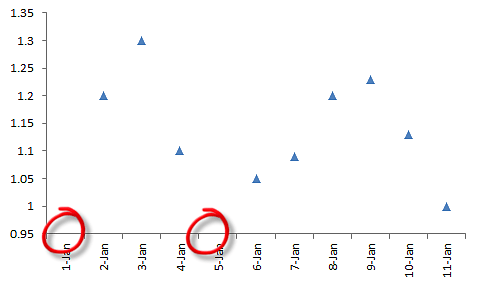
Missing-Values-Plot.png
Missing Intermediate Values Plot
-
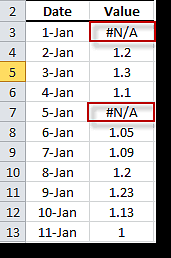
table-with-missing-obs.png
Missing Values Table
-
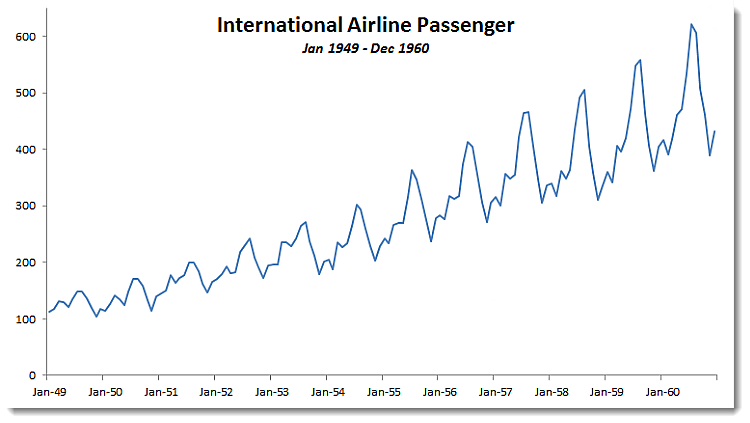
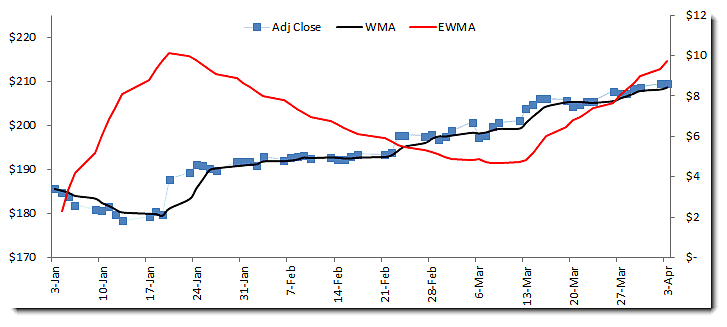
Original_Data_Plot_1.png
International Airline Passenger Plot
-
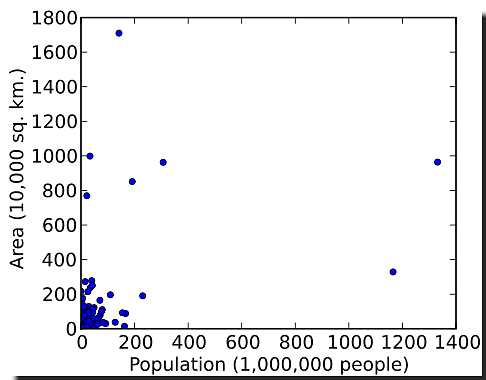
population-density-plot.png
Population Density Plot
-
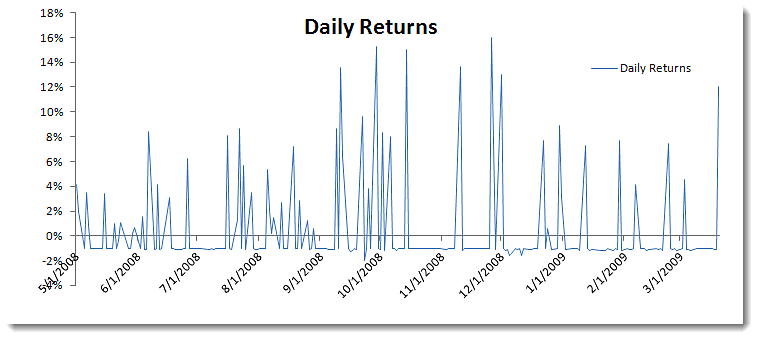
StrategyA-1.png
Daily Returns Strategy Plot
-
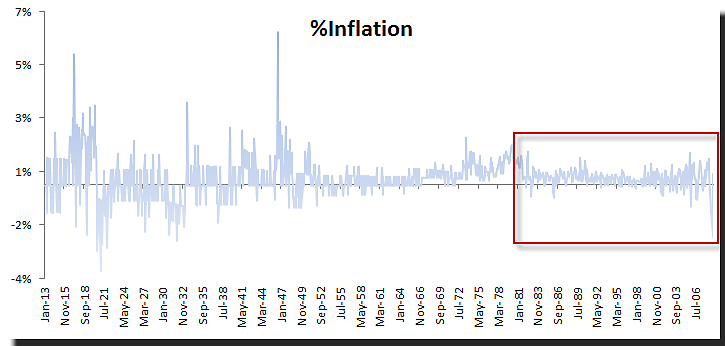
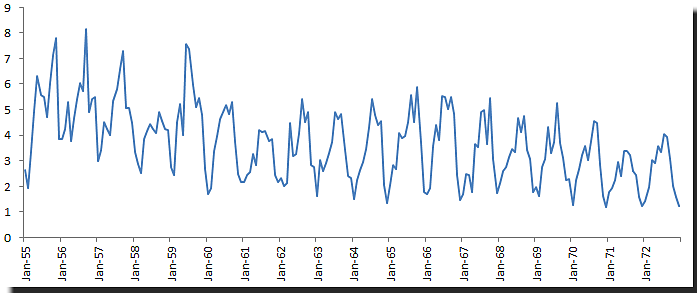
INFLATION-PLOT.png
Inflation Rate Data Plot
-
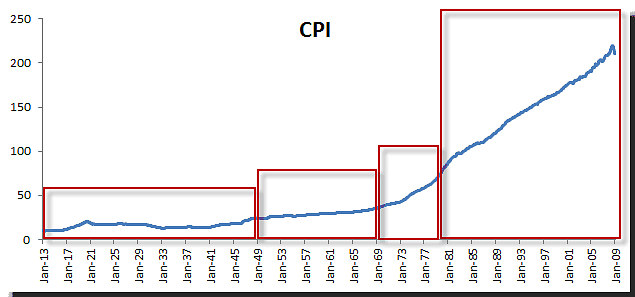
CPI-PLOT.png
US Consumer Price Index plot
-
DATA-PLOT_0.png
Los Angeles Ozone Levels Data Plot
-
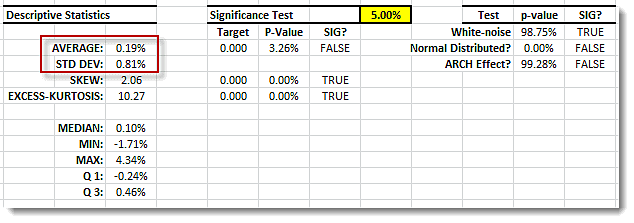
IBM-DLY-RET-STATS.png
IBM Closing Prices Descriptive Statistics
-
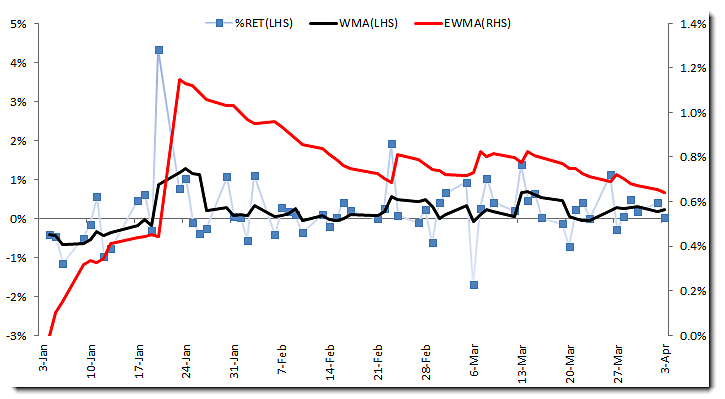
IBM-DLY-RET-PLOT.png
IBM Stock Daily Log Returns Plot
-
IBM_Price-Process.png
IBM Daily Closing Prices Function Process Plot
-
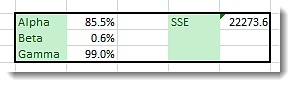
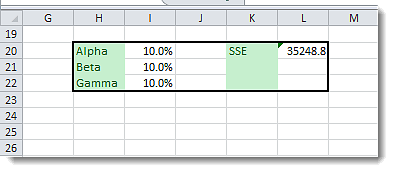
Intl-Passenger-TESMTH-OPTIMAL-PARMS.png
The optimal alpha, beta and gamma for the triple smoothing function that minimize the sum of squared errors
-
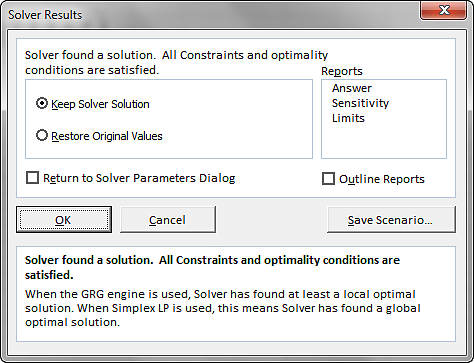
Intl-Passenger-TESMTH-SOLVER_COMPLETE.png
solver searches for optimal solution, ultimately prompting its completion
-
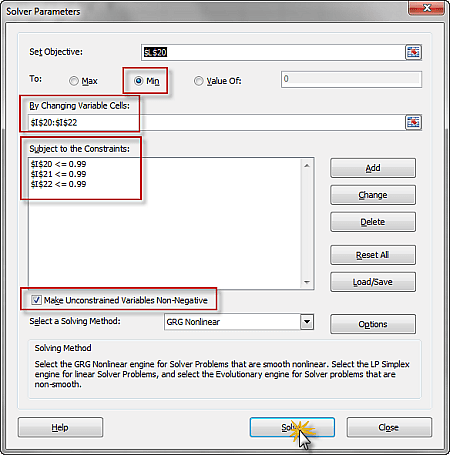
Intl-Passenger-TESMTH-SOLVER-DLG.png
Launch the solver; set the utility, varying arguments and the constraints.
-
Intl-Passenger-TESMTH-PROBLEM-STATEMENT.png
Setup the minimization problem with the sum of squared errors as the utility function