-
msft-log-price-qqplot.png
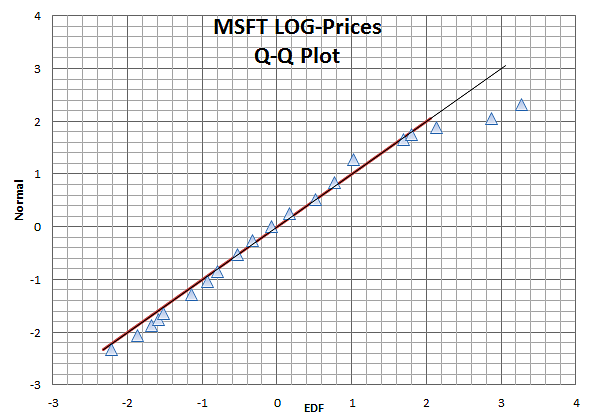
A QQ Plot for the distribution of Microsoft stock log prices.
-
msft-log-price-histogram.png
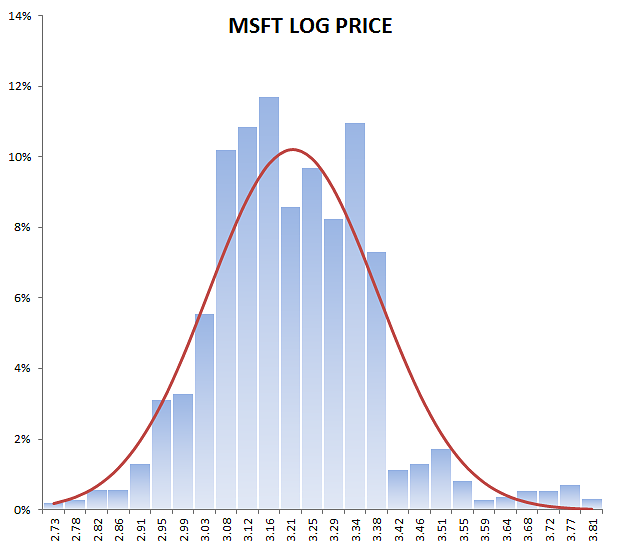
Histogram plot for log log daily prices for Microsoft stock.
-
msft-prices-qqplot.png
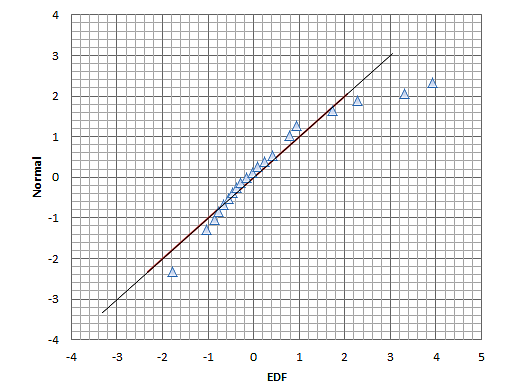
A QQ Plot for Microsft price distribution between Jan 2000 and Jan 2009
-
msft-prices-histogram.png
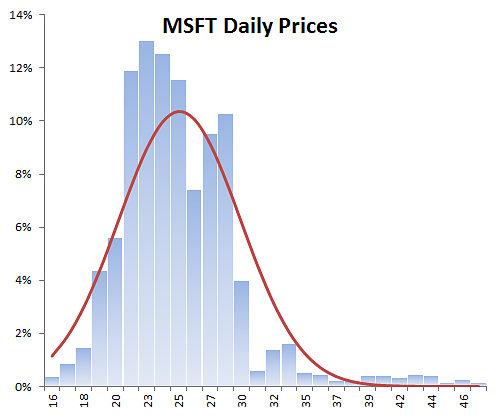
Histogram for daily microsoft prices between Jan 2000 and Jan 2009
-
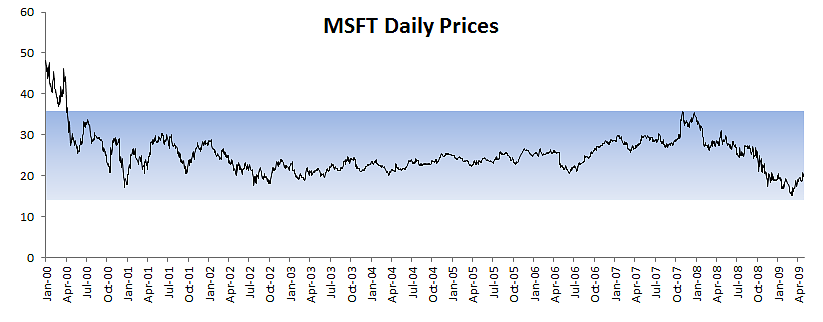
msft-prices-q1-q3-band.png
Microsoft stock price plot with a shaded band represent values between 1st quartile (Q1) and third quartile (Q3)
-
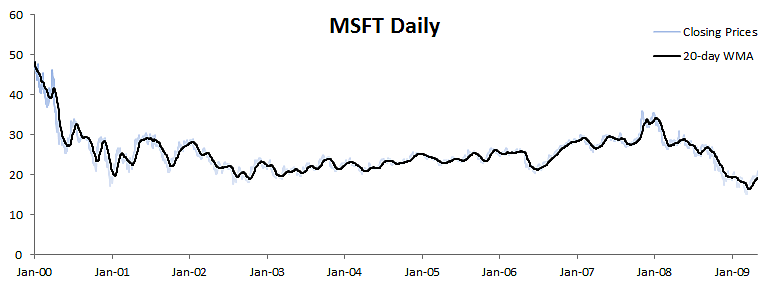
msft-price-wma-plot.png
Microsoft stock price plot with 20-day equally-weighted moving average
-
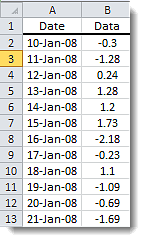
Descending-table-0.png
-
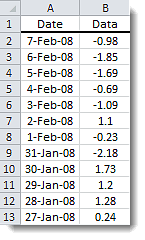
Ascending-table.png
Data table showing a descending chronicle order
-
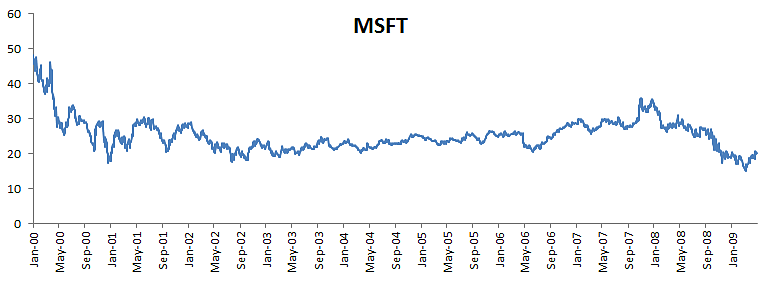
msft-price-plot.png
Microsoft stock price plot. Microsoft stock prices between Jan 2000 and Jan 2009
-

logo-500x500-24-bits-and-72-dpi.png
-

spider-logo-200x200.png
-
NumXL Box
3D NumXL Product Box
-

Spider Financial Logo
High Resolution - 300dpi for press print 500x500 pixels
-
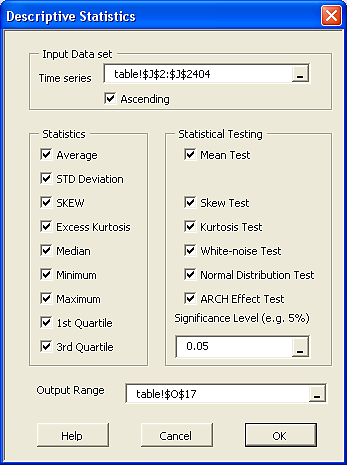
Descriptive-Stat-Dlg.png
-
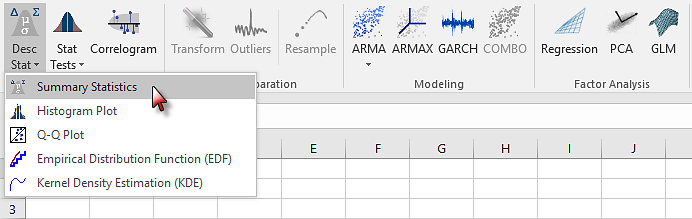
Invoking Descriptive Statistics Wizard in Excel
Click on the Descriptive Statistics icon in NumXL Tab
-
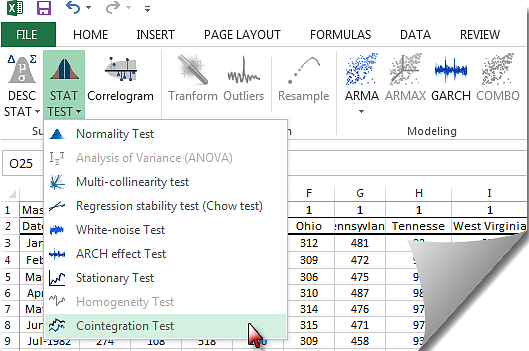
cointegration-menu.png
-
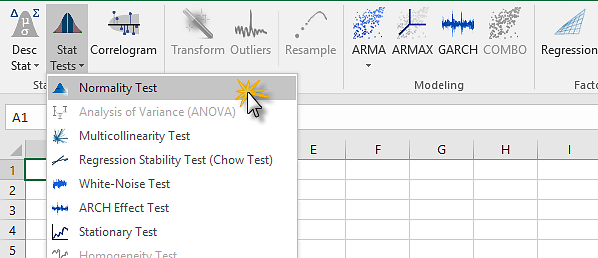
stat-test-menu-normality.png
Locate and click on the Normality test icon in NumXL toolbar
-
Histogram1.jpg
-
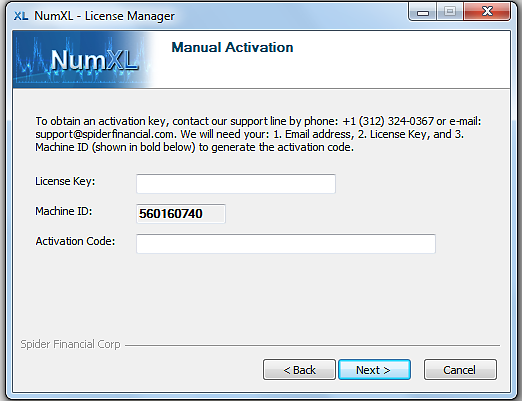
lmactivation-manual-info.png
-
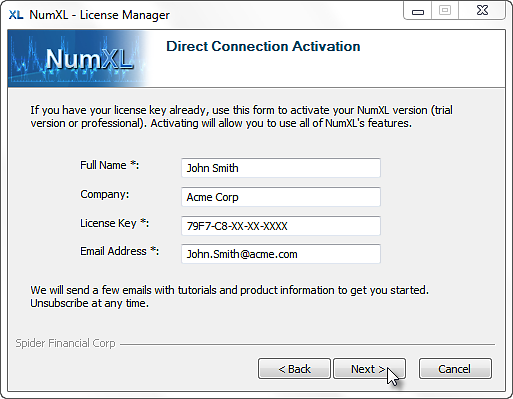
lm-activation-direct-page2.png
-
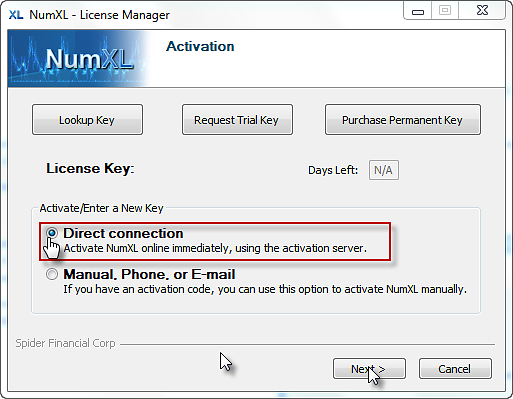
lm-activation-direct-page1.png