-
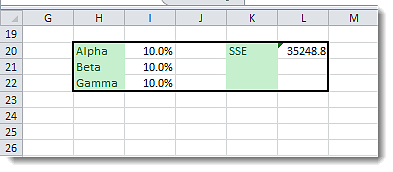
Intl-Passenger-TESMTH-PROBLEM-STATEMENT.png
Setup the minimization problem with the sum of squared errors as the utility function
-
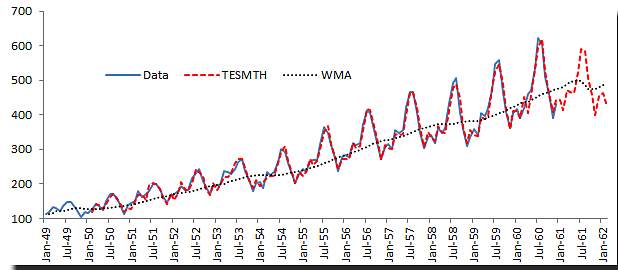
Intl-Passenger-TESMTH-PLOT.png
International passengers' airline data with winter's triple exponential smoothing function (season length=12)
-
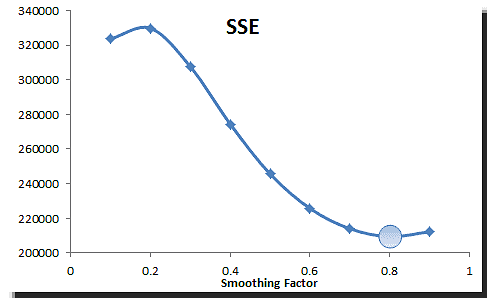
SALES-LESMTH-OPTIMAL-ALPHA-PLOT.png
Sum of squared errors plot for changing values of the smoothing factor, in an attempt t find optimal value
-
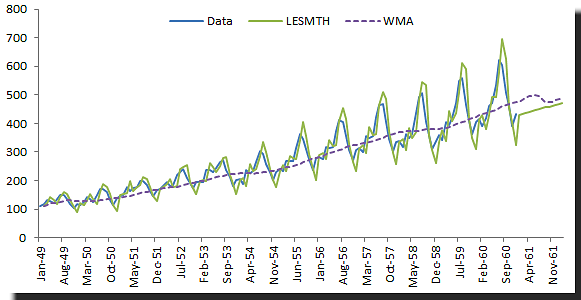
Intl-Passenger-LESMTH.png
International passengers' airline data with brown's linear exponential smoothing function
-
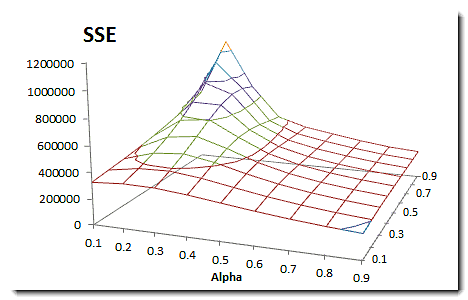
SALES-DESMTH-OPTIMAL-ALPHA-PLOT.png
Sum of squared errors plot for changing the smoothing and trend smooth factors, in an attempt t find optimal values
-
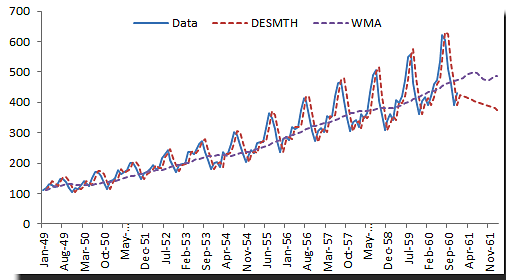
Intl-Passenger-DESMTH.png
International passenger's airline monthly data with Holt-winter's double exponential smoothing function
-
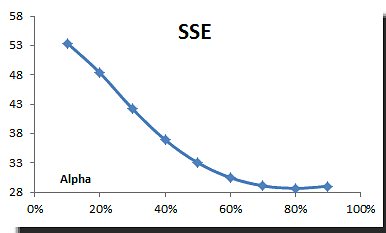
SALES-SESMTH-OPTIMAL-ALPHA-PLOT.png
plotting the sum of squared error for simple exponential fit using different smoothing factor value to find the optimal value
-
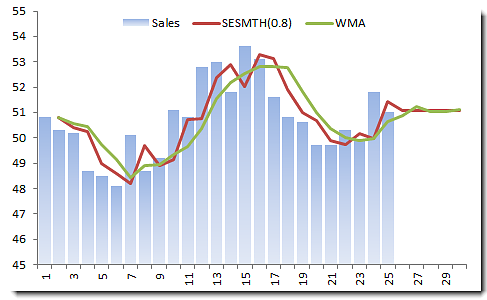
SALES-SESMTH-PLOT.png
sales monthly data with Brown's simple exponential smoothing (alpha=0.8)
-
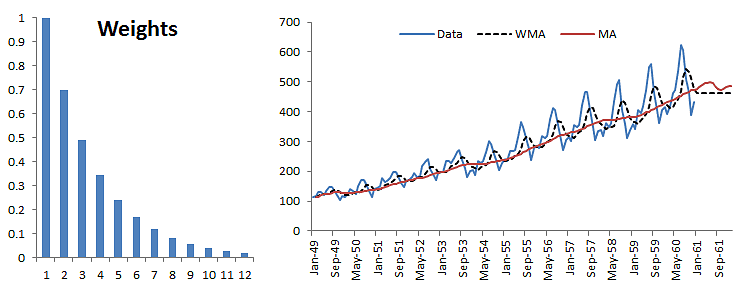
Intl-Passenger-WMA-12.png
international passenger's airline monthly data with 12-month weighted moving average
-
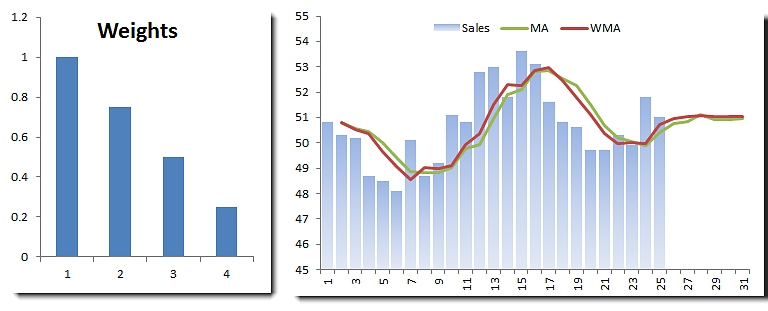
SALES-WMA-4-PLOT.png
monthly sales data with 4-month moving average (more weights to recent observations)
-
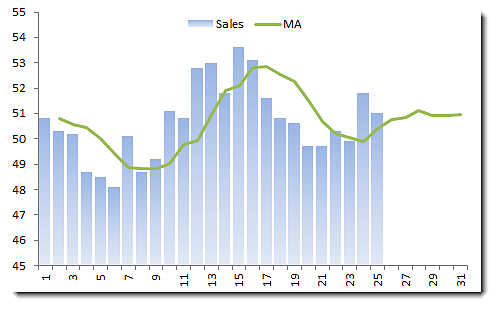
SALES-MA-PLOT.png
monthly sales data with 4-month moving average (equal-weighted)
-
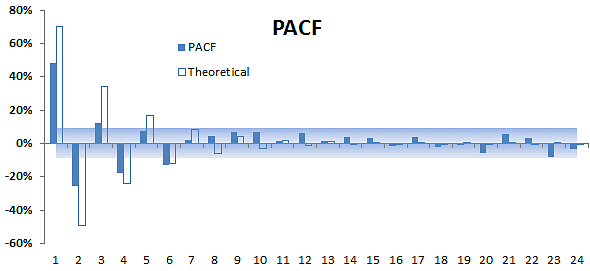
MA-1-PACF.png
PACF Plot for Simulated MA(1) Process
-
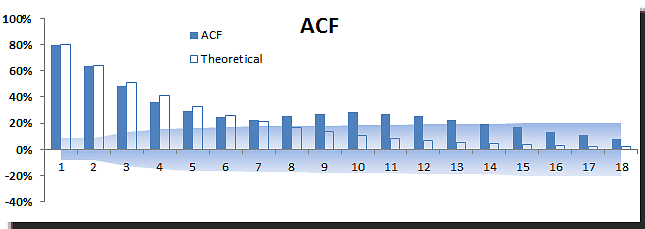
ARMA-1-1-ACF.png
ACF Plot for Simulated ARMA(1,1) Process
-
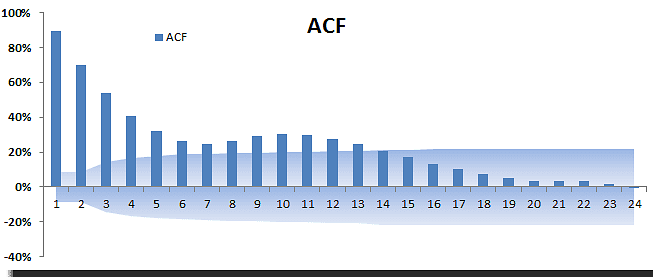
AR-2-ACF.png
ACF Plot For Simulated AR(2) Process
-
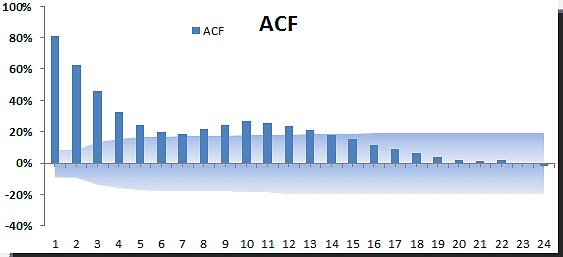
AR-1-ACF.png
ACF Plot For a Simulated AR(1) Process
-
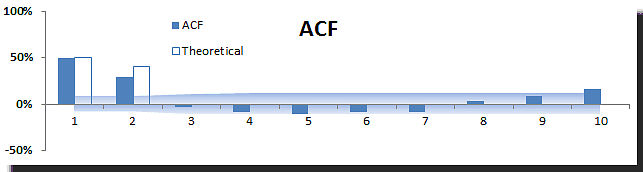
MA-2-ACF.png
Autocorrelation Function Plot for Simulated MA(2) Process
-

MA-1-ACF.png
Autocorrelation Function Plot for Simulated MA(1) Process
-
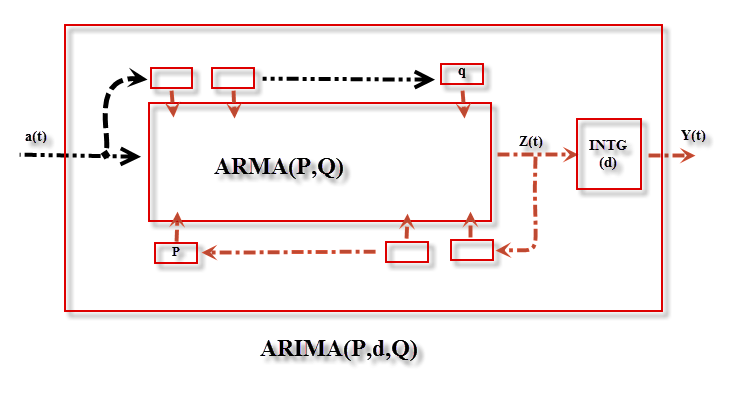
ARIMA-Machine.png
A graphical representation of an ARIMA Excel process
-
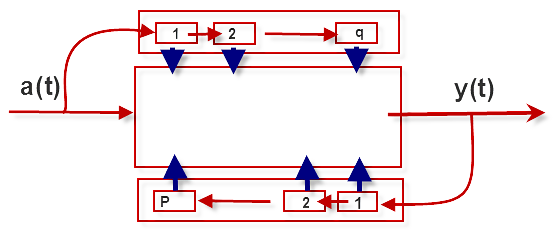
System-view.png
-
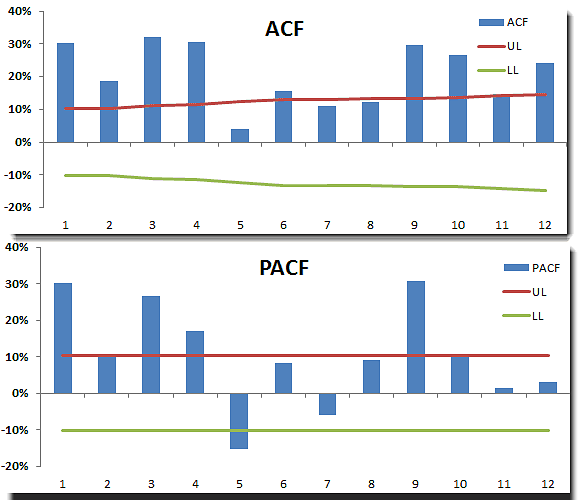
IBM-RET-SQ-CORRELOGRAM-PLOT.png
IBM Squared Time Series ACF and PACF Plots
-
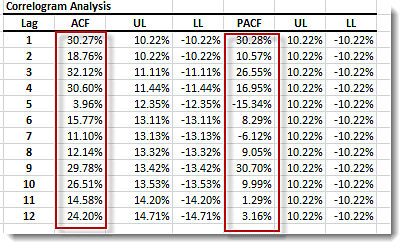
IBM-RET-SQ-CORRELOGRAM-TBL.png
IBM Returns Correlogram Analysis Table