-
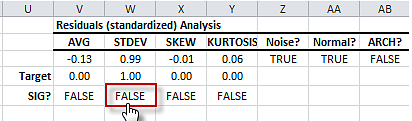
Residuals Diagnosis - Testing for standard deviation(i.e. sigma)
In the residuals diagnosis table, we perform a statistical test for the significance of the standardized residuals standard dev…
-
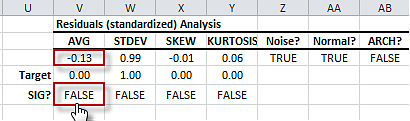
Residuals Diagnosis -Examine the mean of the residuals
In the residuals diagnosis table, we perform a statistical test for the significance of the standardized residuals mean against…
-
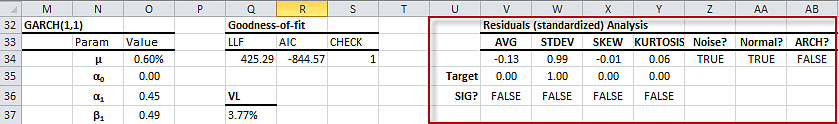
Residuals diagnosis section in GARCH Model table
In the generated GARCH model table, the rightmost section contains tests and check for the standardized residuals to verify the un…
-
GARCH(1,1) Model table with calibrated values
Upon solver successful completion, the optimal values of the GARCH(1,1) model are inserted in the table, and calculation referenci…
-
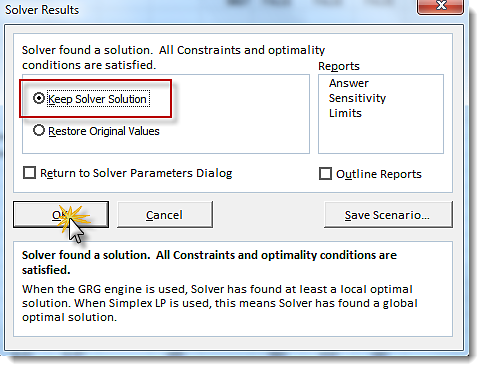
Excel Solver Found a Solution for GARCH(1,1) calibration
Excel Solver found a solution for the calibration problem of the GARCH Model
-
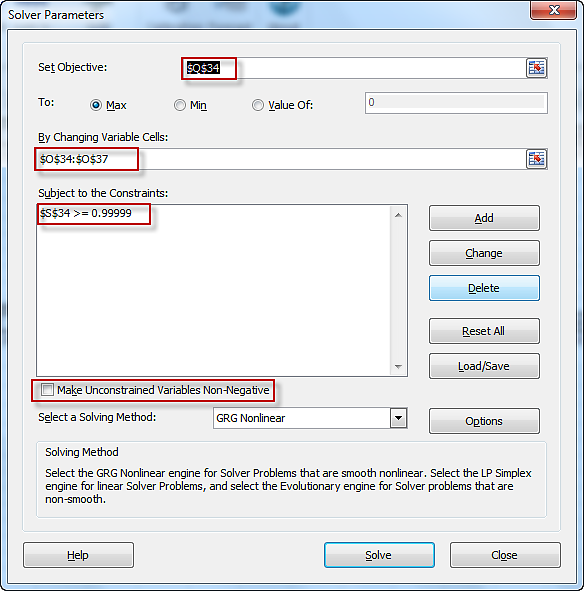
Excel Solver with GARCH(1,1) model calibration settings
NumXL launch Excel Solver with its fields initialized with model's cells: parameters, utility function (i.e. LLF) and the constrai…
-
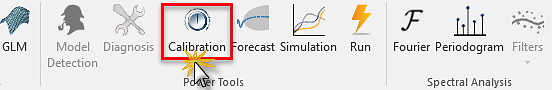
Selecting the calibration icon in NumXL toolbar
Select the header cell of the model table, Locate the calibration icon in NumXL Toolbar (aka Tab), in the Power Tools section, and…
-
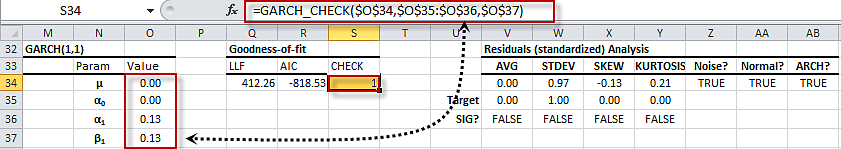
GARCH(1,1) - Model stability check
In the middle part of GARCH(1,1) model table (aka Goodness of fit), note the formula under the CHECK. The function GARCH_CHECK ref…
-
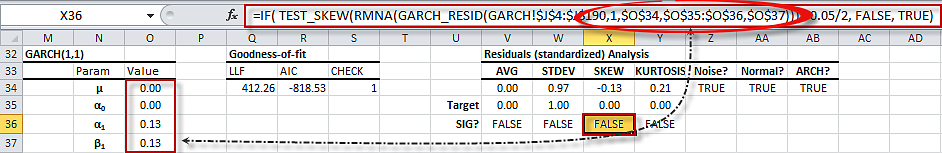
Generated Formulas in the Residual Diagnosis section of GARCH model table.
The Residuals diagnosis section of GARCH(1,1) model table is dynamic; note the generated formula references the input cells range…
-
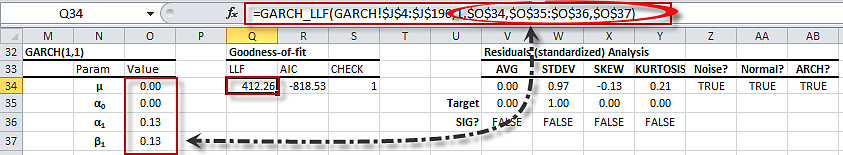
Generated formulas in the GARCH(1,1) model table
The generated GARCH(1,1) model table is dynamic; note that cells are populated with formulas the references model's parameters cel…
-
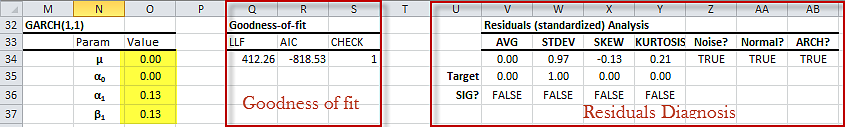
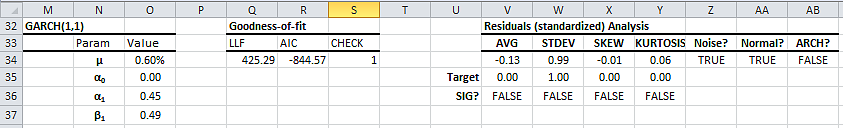
GARCH(1,1) Model table
The GARCH(1,1) model output table generated by NumXL GARCH wizard for the S&P 500 ETF log monthly returns time series.
-
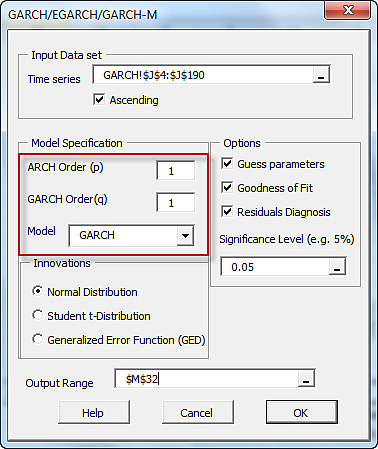
NumXL ARCH/GARCH Wizard
In the NumXL GARCH model wizard, enter the orders of the ARCH and the GARCH components. Leave Model selection to as GARCH
-
Selecting GARCH Wizard in NumXL Tab
Locate the GARCH icon in NumXL Toolbar (aka Tab), and click it to invoke the ARCH/GARCH Wizard.
-
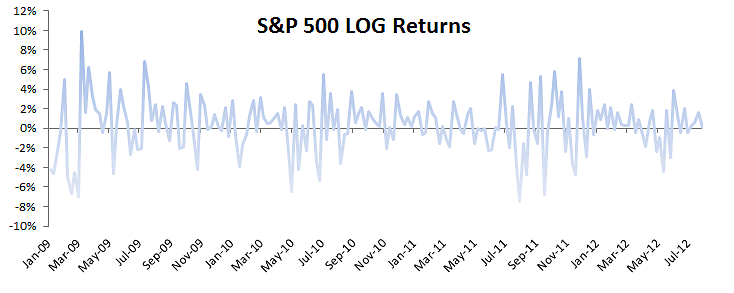
Plot for S&P 500 monthly log returns
A plot for the S&P 500 ETF log monthly returns between Jan 2009 and July 2012
-
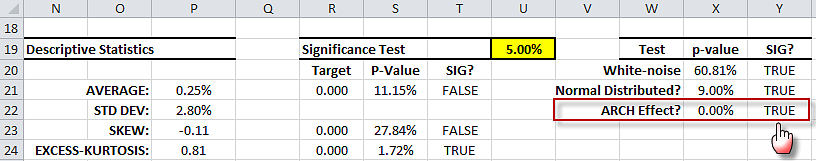
The summary statistics table showing ARCH effect test
ARCH Effect test results for S&P 500 monthly log returns
-
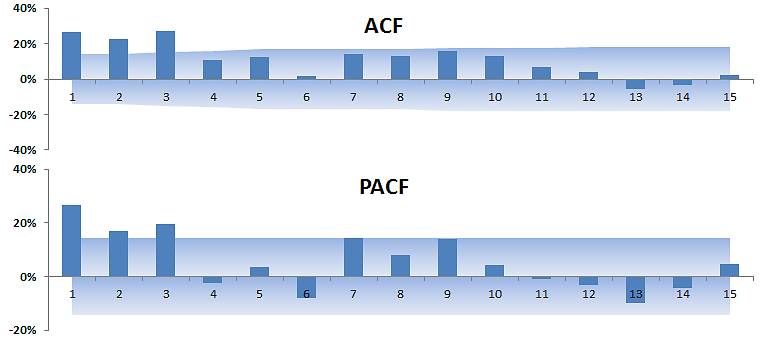
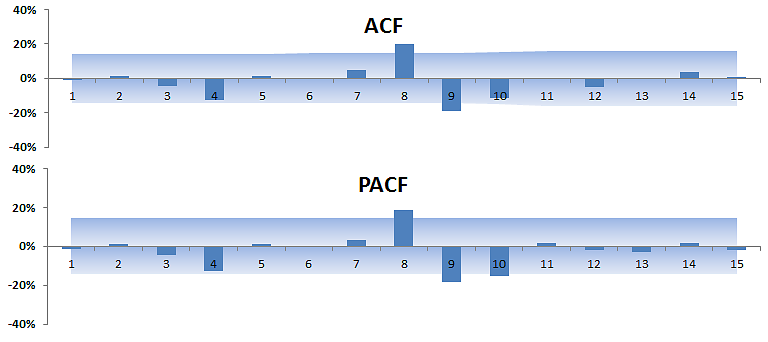
Correlogram plot for S&P 500 squared log monthly returns
Correlogram or ACF and PACF plot for the S&P 500 squared log monthly returns
-
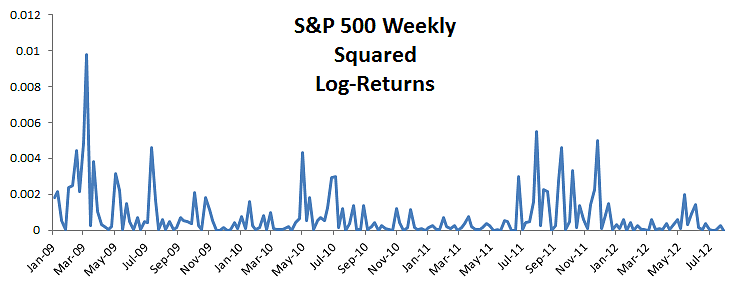
Plot for the S&P 500 squared monthly log returns.
Plot for the S&P 500 squared monthly log returns.
-
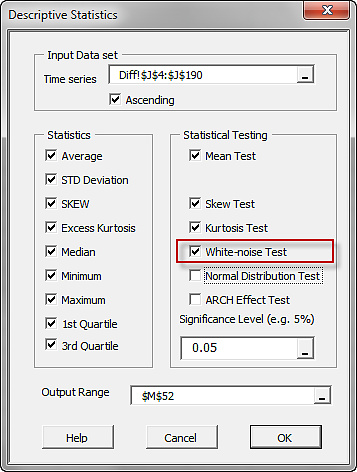
Select white-noise test in NumXL Descriptive Statistics wizard.
selecting a white-noise test in NumXL descriptive statistics wizard or dialog box.
-
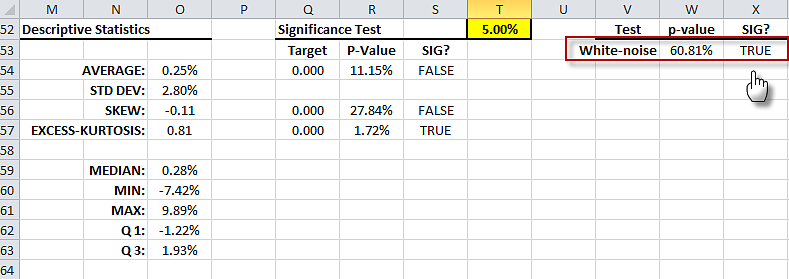
Summary Statistics table for S&P 500 monthly log return
Summary Statistics output table for S&P 500 monthly log returns with highlighted white-noise test.
-
Correlogram plot for S&P 500 monthly log returns
The Correlogram or ACF & PACF plot for S&P 500 monthly log returns. (Generated by NumXL correlogram wizard)
-
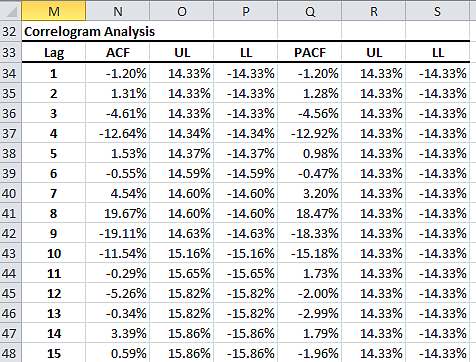
Correlogram table for S&P 500 monthly log returns
Correlogram output table for the S&P 500 monthly log returns.